Roots Inspection


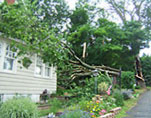
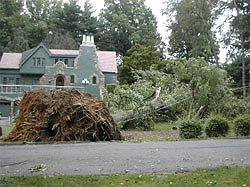
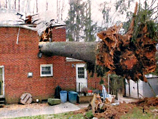
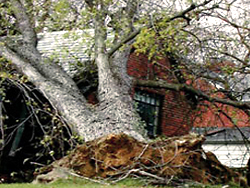
Most trees fall over because of compromised roots due to factors such as decay, severance during construction, and constricted growing conditions. At present, the only root inspection procedure is invasive – excavation – by either digging or use of a hyper-sonic velocity "air gun" that blows away the upper soil.
TRU offers a non-invasive method for roots inspection that provides the following information:
- 2D Planar Image of each Line Scanned showing Root Location (along the scan line) and Depth – "Virtual Trench "
- 3D Top-Down Image showing Root Layout at any desired Depth Slice – "Virtual Excavator"
The 2D planar view is called a "Virtual Trench " because it is the same view that would be seen if a backhoe were to dig a trench as long as the line scanned and an observer were to step down into the trench and examine the severed root endings to determine their location, depth, and diameter.
The 3D top-down view shows the image that would be seen by an observer in a bucket truck looking down
into the soil. The root layout is seen and along with its density in any direction from the trunk.
TRU™ System for Subsurface Structural Roots Inspection
Advantages include:
- Non-Invasive
- Portable, via Battery Supply
- Minimal Set-Up
- Rapid Scanning – complete Ground Coverage in 30 to 60 minutes
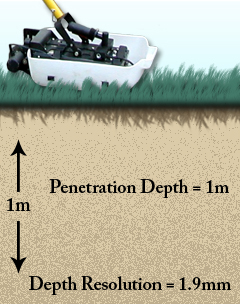
- Penetration down to 39 in (1 m)
- Scan either Uncovered or Covered (penetrates concrete, asphalt, paving slabs) Soils
- High-Resolution Images of Subsurface Structural Roots
- Scan either Parallel Straight Lines on any Side of Tree or Concentric Circular or Semi-Circular Lines
- Scan in Tight Quarters in Urban Areas
- Easy to Use
- Accurate and Fast
Root Inspection using the TRU™ System
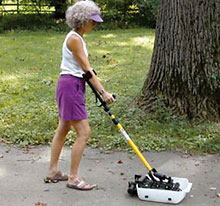
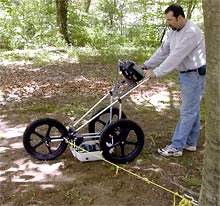
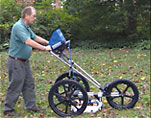
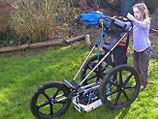
The antenna is placed in a custom teflon-impregnated tub and then scanned along the ground (covered or uncovered) surface using either the manual extendable handle fixture or the semi-automated mobile scanning cart.
The manual fixture is useful for ground scans where access is limited such as along narrow sidewalks in urban areas or when scanning landscaped gardens surrounding trees. The semi-automated mobile cart is useful for all types of ground where access is slightly better.
Scan lines can be either parallel lines or circular or semi-circular lines at varying distances from the trunk. A 2D planar image ("virtual trench") is created for each line scanned, and a top-down 3D image is created to show the root layout – location and depth – for the collection of lines scanned.
 |
 |
|
Root Scanning using the Manual Extendable Handle. Antenna is placed in Custom Teflon-impregnated Tub and Survey Wheel protrudes from back end of Tub. |
Root Scanning using the Semi-Automated Mobile Scanning Cart. Antenna is placed in Custom Teflon-impregnated Tub and Survey Wheel rubs against rim of one of the large Rear Wheels. |
Roots Scan Data Results
Virtual Trench - 2D Planar Depth Image of Root Location (top scale, ft) and
Depth (left scale, in) for One Scan Line
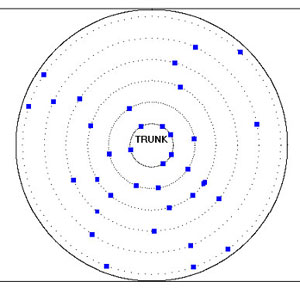
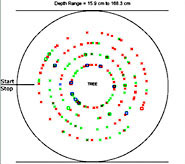
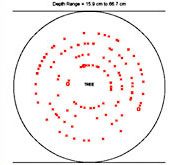
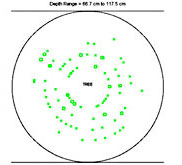
The image to the right shows a 3D top-down view of the root layout and density. The first circle is at a 4 ft (1.2 m) radius from the trunk. Every other circle is at a radial increment of 2 ft (0.6 m).
Top-Down 3D Image
of Subsurface Structural Roots at Four Depth Slices
 Depth Slice: Surface to 15in |
 Depth Slice: Surface to 5in |
 Depth Slice: 5in to 10in |
 Depth Slice: 10in to 15in |
Creation of Root Morphology and Root Density Maps
1. Each Scan Line produces a “Virtual Trench” which is a 2D plot or Distance along Scan (Horizontal axis) vs Depth (Vertical axis)
2. Virtual Trench is shown as a 2D Display where each detected root appears as a dot.
3. Virtual Trench map can also be shown as a colored Root Density map.
4. Ensemble of detected roots (‘dots’) are then shown in a top-down (plan view) map where each root is color coded to represent depth.
5. Root Morphology 3D map is generated by a connect-the-dots algorithm that forms linkages between roots scan lines at varying distances from the tree trunk.
6. Root Surface Density map shows the overall root density as a contour map.
Virtual Trench Visualization
- Legacy Linear Scan Plot displays root hits projected to the surface and colorized by their depth zone
- Virtual Trench Plot shows the locations of roots within virtual trenches corresponding to the depth penetration of TRU radar scans
Virtual Trench Plot
Four linear scan lines of data with root hits colored in red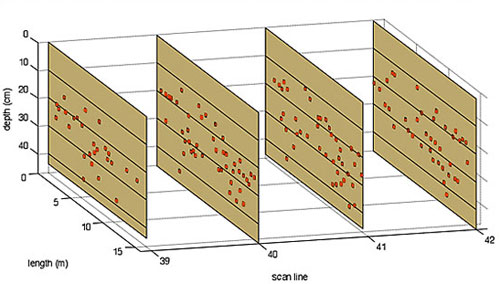
Virtual Trench Plot
Density of root hits within each of the four linear scan lines
(red = higher density, blue = lower density)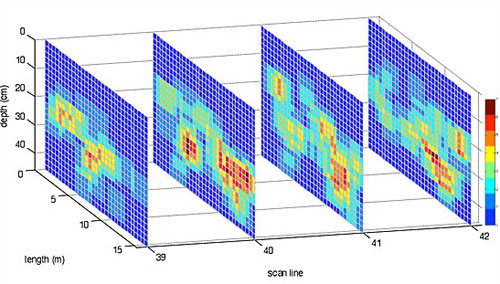
Root Morphology Mapping
- Legacy Circular Scan Plot displays root detection hits (“dots”) projected to the surface and colorized by their depth zone
- Root Morphology Mapping Plot shows a morphology conjecture produced using a customized algorithm to associate the individual hits into linear segments
Root Scan Layout
Four Concentric Circular Scans with 0.5m (20in) spacing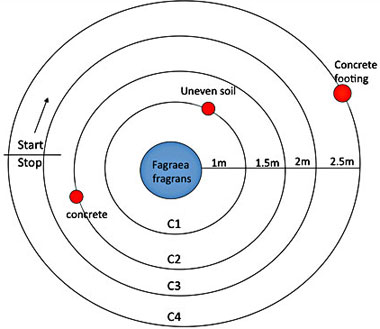
Four Concentric Circular Scans |
 |
 |
 |
Morphology Mapping Plot 3D view of Fagraea fragrans 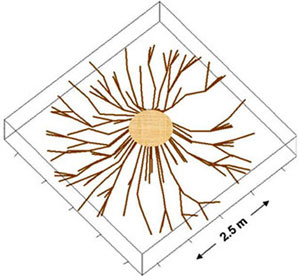 |
Root Surface Density Map 3D view of Fagraea fragrans 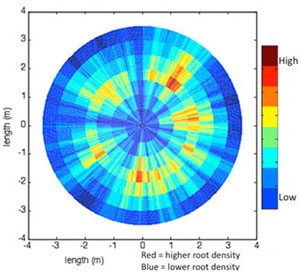 |

Saving Trees,
One at a Time.
Saving trees requires knowledge of their internal trunk and subsurface root structure. Many trees with decay can still survive well for many years. But only if the extent of the decay is known and found to be within acceptable safety bounds. TreeRadar’s advanced technology provides the information to help certified arborists make this risk assessment.

TRU™ Root Inspection
The TRU system can non-invasively inspect soils - either covered or uncovered - to provide images of the layout and density of subsurface structural roots.

A TRU™ Helper
Even a small helper can conduct root scans! Pictured below is Ellie, who was happy to help her dad conduct a root scan. Click the image for a larger view.
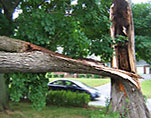
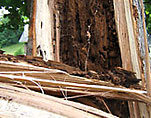
Root Decay
Trunk Decay